This is a Realvolve Engineering blog post that provides insight into the inner workings of our software.
This article is about improving our app server configuration, especially for web apps running on Heroku PasS. In this article, we will share our lessons learned and discuss how we can optimally use Heroku dynos without any need of aggressively scaling in dyno counts as the traffic grows.
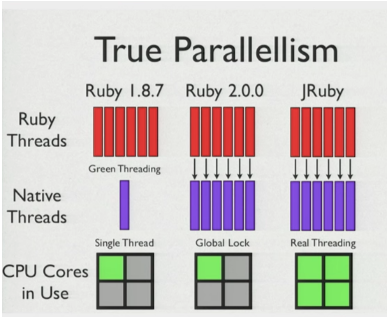
You may have heard that Ruby does not support true multithreading. There are various implementations of Ruby that do, but one of the most popular Ruby implementations, MRI, doesn’t support it. Well…it does of some sort, but it is nothing that people would exploit, given the increased number of cores in machine in recent years.
Ruby programming can have many threads, so why do people say that MRI doesn’t support multithreading? You might have heard of Global interpreter lock (GIL), which only allows one thread to be executed at a time, and which does context switching to allow each thread a chance to execute for a particular time period. This implementation guarantees thread safety for native implementation of Ruby method, but it restricts threads to run on different cores at the same time. Rails running on MRI come with some caveats.
Other implementations of Ruby, like Jruby or Rubinius, do not have GIL and it supports true multithreading. As you figured out from the title of this post, it is not about GIL. But understanding that MRI doesn’t support true multithreading allows us to understand why web servers like Unicorn do not depend on threads to handle multiple requests in parallel.
This is how parallelism looks in MRI vs JRuby:
If you want to dig up more on GIL, here is a great place to start: https://www.jstorimer.com/blogs/workingwithcode/8085491-nobody-understands-the-gil
MRI doesn’t allow threads to execute on parallel, so how does an app server like Unicorn handle multiple requests on parallel? They don’t. We just run multiple processes of the same app in parallel and each process is a whole app in itself and can handle one request. So if we have n number of processes running in parallel, we can handle n request concurrently.
App servers like Unicorn allow concurrency by means of forking processes. The more processes we have, the more requests we can handle. Unicorn uses one master process and forks multiple children out of it. When we configure Unicorn to use 10 worker processes, it does so by forking the master process ten times. And now we have 10 child processes and 1 master process.
To handle more requests, we need more worker processes (instances of app). This is simple, but how many instances would you need for running a particular app in production? We hit this question when a number of requests in one of our apps on Heroku were just waiting in the request queue and getting terminated for waiting so long in there. First, we suspected some code was taking a large amount of time and not allowing other requests to be handled. We checked new relic, but there were not many requests consuming that amount of time. Once we started checking the number of requests that we were receiving, we were sure that we needed to check somewhere else. We switched our focus to checking our app server configuration and finding out the number of processes that we would need to handle the request that we were getting. Going over a web, we discovered something amazing. A formula to find out application instance that we would require to handle the request.
Minimum application instances required = (req/sec) * average response time (in seconds)
Isn’t it amazing? It’s so damn simple, and it makes sense, too. Once we started putting values in this formula, we came to know that we were running on less than half the number of app instances that we required. We were having just 8 app instances, but we needed at least 20 instances.
We knew we needed to increase our app instances to handle more requests, but we were not sure how many instances each dyno would be able to manage. When we started checking memory consumption metrics of Heroku, we were surprised by the fact that we were under-utilized with our memory consumption. We were only utilizing 30% of our available memory. We didn’t want to rush to any conclusion, so we decided to increase our worker processes incrementally over 2 weeks (with the help of the above formula) and we closely monitored resource utilization. At the end of this experiment, we were able to bring down the number of dynos by half. Now we are running with half the number of dynos and 10 instances per dyno (via Unicorn configuration) and it is able to handle 20 requests in parallel. Now we are consuming over 60% of our memory that we pay for. We didn’t just save infrastructure costs; we also saved some efforts in analyzing and debugging code that we thought might be the cause of this problem.
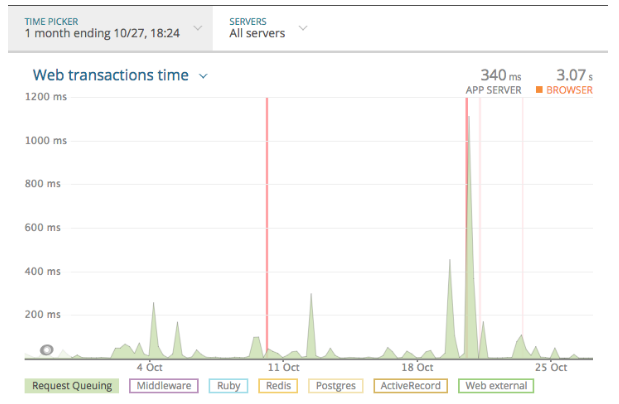
Here is our newrelic graph before doing this change, showing the time the request used to wait in request queue. It’s taking as high as 1000ms in the request queue and causing a few crashes as well.
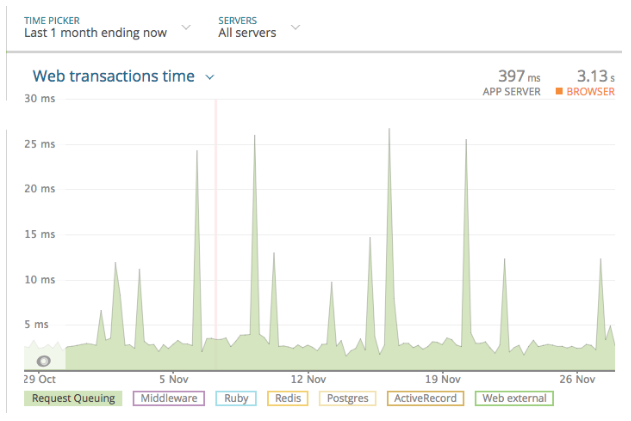
Here is what our newrelic has to say after we made above changes. No request waited for more than 30ms.
So what did we learn with server configuration and tuning on Heroku using Unicorn?
We learned that:
- Increasing or scaling Heroku dynos (i.e. adding more dynos) is not just the solution to manage traffic or load in web applications. We need to look at how server load is spread across various instances and how memory is utilized. Accordingly, we should have the right set of workers (parallelization) to manage load.
- Aggressive monitoring. “What gets monitored gets managed.” Keep performing data analysis of various key system metrics (cpu, memory, rpm, throughput, others daily and weekly)
- Do not assume anything, instead chase root cause always
“Issues are not always where you look. Sometimes, they’re lurking in a corner that you wouldn’t typically be exploring.”
Next Steps
- We are still tuning our average app server response timings to bring them under < 200 ms. Our SOLR (search engine) response time is pretty high currently and it’s affecting our app server response time. Thus, we are pursuing Solrcloud (sharding our large solr search index)
- We are also tuning our mean average browser response time to bring it under < 3s
References:
Here is a link to an excellent video that talks about this formula and how to tune Heroku app instances. This video really helped us for server tuning. Thanks to Nate Berkopec.


